Wiki Getting started
The main window and controls
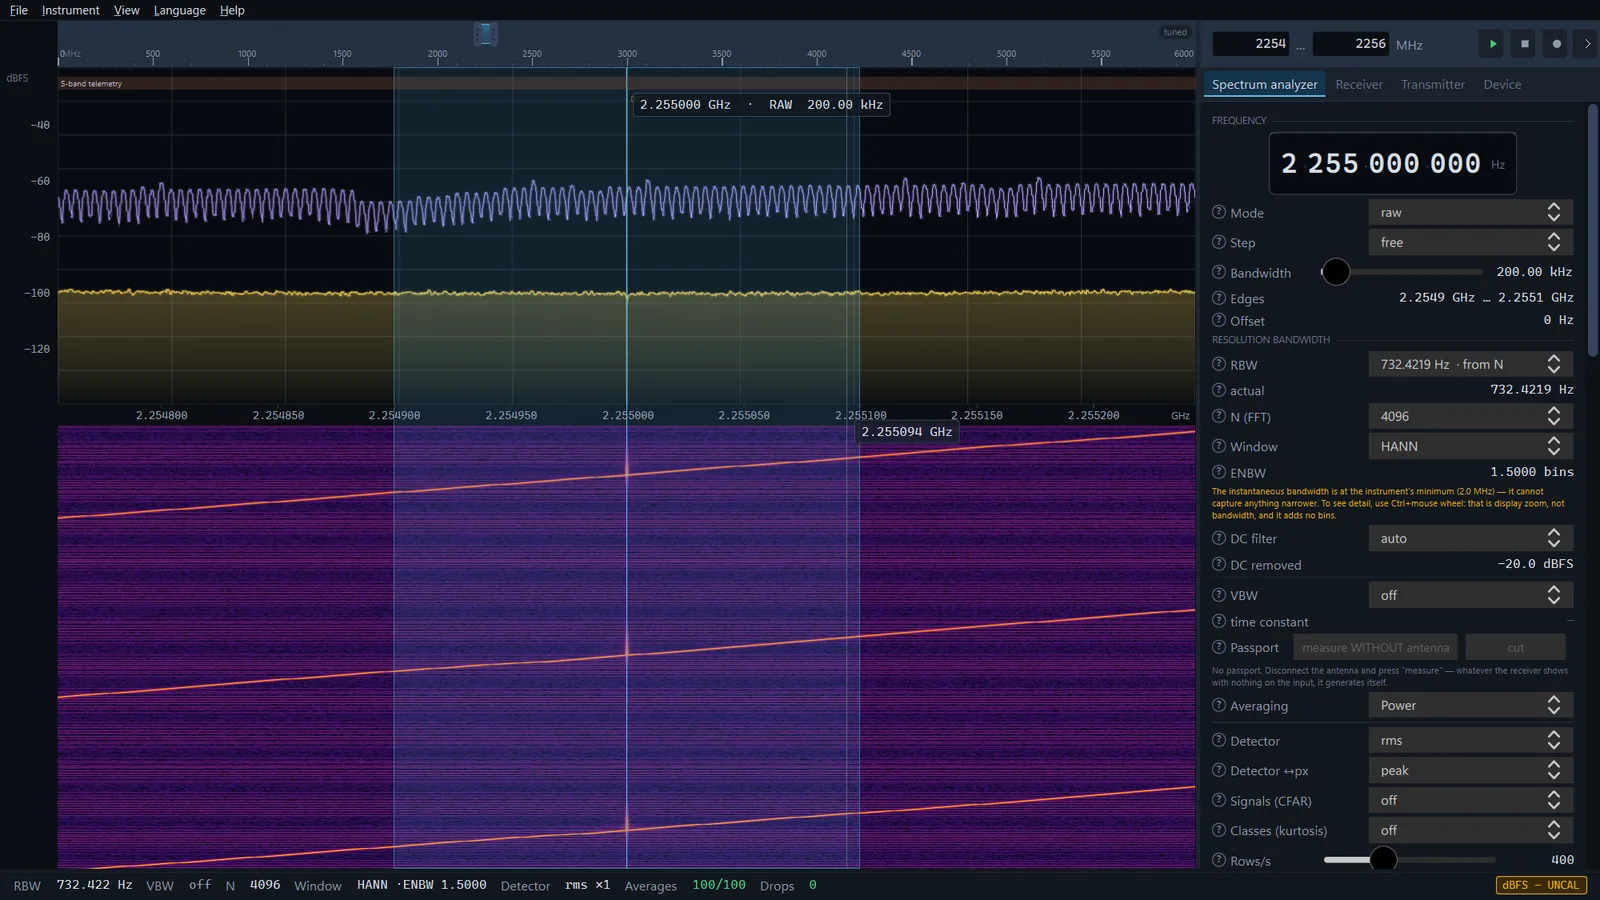
The main window consists of the graph on the left (overview ruler, spectrum, waterfall), a side panel with four tabs on the right (five in SDR SA PRO with a valid key) and the trust bar at the bottom. This page covers every element of the window and all the mouse and keyboard actions the app has.
What the window is made of
- The overview ruler at the top of the graph — the device's whole range and the span taken from it.
- The spectrum — level against frequency: traces, the receive band (VFO), marks.
- The waterfall below the spectrum — the same levels over time, newest row at the top.
- The side panel on the right — all the controls, organised into tabs.
- The trust bar — a line at the bottom of the window with the settings and losses behind the picture.
- The menu at the top of the window: File, Instrument, View, Language, Help.
The graph stays dark in both the dark and the light theme: the waterfall palettes and the trace colours are designed for a black background.
Spectrum and waterfall
What is drawn
- Axes
- On the left, the level axis with its unit at the top: dBFS for a HackRF One, an RTL-SDR 0.9.25, the demo signal and recordings, dBm for a tinySA 0.9.25. Between the spectrum and the waterfall, the frequency axis with its unit on the right. The frequency axis labels every bin with its true frequency 0.9.39; in older versions the labels sat half a bin too high, and the sweep picture a whole bin.
- Cursor
- A thin vertical line across the spectrum and waterfall and a label with the frequency under the cursor.
- Receive band (VFO)
- A translucent band with a line at the tuned frequency and a label that shows the frequency, the mode and the filter width. This is what the receiver listens to and what zero span measures. The band turns red when it extends past the edge of the captured band — the trust bar then shows BAND CLIPPED. For a tinySA the band does not turn red 0.9.41: it has no receiver, and a sweep narrower than the VFO band is not an error.
- The DC mark
- A vertical line at the centre of the captured band: the peak there is a property of the receiver, not a signal on the air. The explanation appears when you hover over the mark. With the DC filter on, the mark is dimmer and reads DC−. It is absent in a sweep and for a tinySA.
- Band strips
- Translucent labels at the top of the spectrum (FM broadcast, Wi-Fi/BT 2.4 and so on). A label shows as many letters of the name as fit; the full name and the edges are in the tooltip. Clicking a strip selects that whole band.
- Marks
- Above the strips — marks of the receiver's own spurs from the passport and marks of spurs that move with the local oscillator. At the bottom of the spectrum — detection marks: CFAR and bin classes (green for a steady level, red for an intermittent one). In detail — on the page Detection marks and the spur passport. In SDR SA PRO PRO the spectrum also carries the trace markers and the Scanner's signal marks — see Trace markers and Scanner.
The mouse over the spectrum and waterfall
| Action | What happens |
|---|---|
| Left click | The VFO moves to the frequency under the cursor — within the captured band. The device is not retuned and the picture does not blink. |
| Left drag | Selects a span and shows its measurement readout (see below). |
| Drag the middle of the VFO band | Moves the VFO. |
| Drag an edge of the VFO band | Changes the filter width; the centre stays where it is. In the usb and lsb modes one of the edges is the tuned frequency itself, and dragging it retunes the VFO. |
| Wheel | Changes the receive band: each notch narrows or widens it by a factor of 1.25 while the frequency under the cursor stays in place. The command goes to the device a quarter of a second after the last notch. The band does not get narrower than the device's lowest sample rate; wider than the highest one is already a sweep. For a recording, which does not retune, the wheel zooms the picture. For a tinySA the wheel narrows and widens the instrument's own sweep — from 10 kHz to its whole range 0.9.41. |
| Ctrl + wheel | Zooms the picture around the cursor, ×1.25 per notch. It is a magnifier over bins already taken: it adds no resolution. |
| Ctrl + left drag | Pan — moves the zoomed picture left or right. Over the VFO band too 0.9.42: before, this gesture dragged the VFO or an edge of its band there. |
| Middle drag | Pan, like Ctrl + left drag. The view stays where you dragged it 0.9.42; before, it returned to the whole band as soon as the button was released. |
| Middle click | Shows the whole captured band (resets the picture zoom). A click without dragging — a hand tremor of less than 4 pixels included. |
| Double-click | Shows the whole captured band. It also works on the VFO band and its edges 0.9.42: the VFO stays where the first click put it, and the release of the second click does not move it. On the label of a named band at the top of the spectrum (a click there selects the band) and on the frequency axis strip a double-click does not reset the view. |
| Shift + wheel | Changes the level range (how many decibels fit on screen), from 20 to 140 dB, and switches the scale to manual 0.9.25. |
| Alt + wheel | Scrolls through the waterfall history in steps of 500 rows. |
| Right button | Context menu. |
| Esc | Closes the menu or clears the selection. |
The difference between the wheel and Ctrl + wheel is fundamental. The first changes how much of the air the receiver really captures (the device's sample rate); the second only stretches a finished picture. When the band is already at the device's minimum, the Resolution bandwidth group says so and suggests Ctrl + wheel.
Selection and measurement
Drag with the left button across the spectrum — the span is marked by two dashed vertical lines with the edge frequencies at the bottom. A readout appears next to it: From, To, Center, Δ (the width), and also Max, Min and ΔP — the highest and lowest levels in the span and the difference between them. The levels are also drawn on the graph as two dashed horizontal lines.
- The levels are taken from the live spectrum, not from the traces, and are refreshed ten times a second: “Max” is what is in the span now, not the highest value a max hold trace has ever seen.
- The selection is kept in hertz, so it does not slide off the signal when you zoom or pan.
- If fewer than eight bins fall inside the span, the readout warns: only N bin(s) — a single reading, not a band. While there are no levels, it says no levels yet.
Context menu
- Zoom to selection
- Makes the selected span the receive band — just as if you had typed its edges into the range fields. A span narrower than the device's lowest sample rate is widened to it. For a tinySA the item narrows the instrument's sweep to the selection 0.9.41; a span narrower than 10 kHz is widened to 10 kHz. The item is available when there is a selection and the source retunes.
- Clear selection
- The same as Esc.
- Select visible
- Selects everything currently on screen. When the picture is not zoomed, exactly the receiver band is selected 0.9.39, and for a tinySA the sweep itself 0.9.41: Zoom to selection then shifts nothing.
- Heat map
- Switches the heat map on and off — a density display in which the colour tells what share of the time the trace spent at each point. Its sliders Persistence and Contrast appear in the Amplitude group. In detail — on the page Scale, auto scale and waterfall.
- Show whole band
- Resets the picture zoom, like a double-click.
The last line of the menu is a hint, Pan — middle button or Ctrl+left, not an action. In SDR SA PRO PRO with a valid key there is one more item after Show whole band, behind a separator: Marker here. It puts a trace marker on the frequency where the menu was opened — see Trace markers.
The level axis
The wheel over the level axis changes the scale range (from 20 to 140 dB); Shift + wheel moves the reference level Ref in 5 dB steps (from −140 to +20). Both actions switch the scale to manual 0.9.25: otherwise the auto scale would take some of the steps back. To return to automatic — Scale: auto in the Amplitude group.
The border between spectrum and waterfall
The frequency axis strip is a handle: drag it up or down to change the share of the height given to the spectrum (from 12 to 88 %). The split is remembered between launches.
Waterfall history
The waterfall keeps 16,384 rows. Alt + wheel scrolls through them; in the Host group on the Device tab the History field shows live or the depth in rows. To return to the live row, use the Back to live button in the Source group, the item of the same name in the Instrument menu, or the L key.
The overview ruler
The ruler shows the device's whole range on a linear scale in MHz. The highlighted rectangle on it is the selected span.
- Drag the handles at the sides of the rectangle to change the edges; drag the rectangle itself to move the span without changing its width.
- The device is retuned when you release the button, not while dragging.
- A span that fits into the device's highest sample rate is taken in a single capture — the badge on the right says tuned, and the app picks the lowest sample rate the span fits into. A wider span starts a sweep: the badge becomes SWEEP · N %, and after the first pass SWEEP · pass N s. Sweeps are covered on the page Sweep.
- For a source that does not retune (an IQ recording) the ruler shrinks to the line The source does not retune — the whole band is already on screen.
The scale is linear, so on a HackRF One (1 MHz – 6 GHz) everything below 100 MHz takes about 2 % of the width. Exact edges at the low end of the range are easier to enter as numbers — in the side panel header.
The side panel
Header: range and the ▶ ⏹ ⏺ buttons
- Range fields
- The lower and upper edge of the selected span in MHz, with up to three decimal places. Enter applies the number; Esc or a click outside the field restores the current value — an unfinished number never becomes a retune command. A comma is accepted in place of the decimal point. Zero is accepted in the lower field when the source's range starts at zero — for a tinySA and the demo signal 0.9.41. In a wider panel the caption Range and the span width Δ appear alongside.
- ▶
- Reception. On from the start; after a pause it resumes the stream (Resume receiving).
- ⏹
- Stop: stop the recording and the stream. It is also the pause: the source stays open and ▶ carries on. Space also pauses and resumes the stream, but does not stop the recording.
- ⏺
- Starts an IQ recording; if the stream was paused, the recording starts it by itself. A second press stops the recording. The button is absent for a tinySA.
- The arrow on the right
- Hide panel (Ctrl+0). While the panel is hidden, the same arrow sits at the right edge of the graph: Show panel (Ctrl+0).
Tabs
| Tab | Groups | Key |
|---|---|---|
| Spectrum analyzer | Frequency, Resolution bandwidth (for a tinySA, tinySA instrument 0.9.25 instead), Amplitude, Traces, Bands, Markers | Ctrl+1 |
| Receiver | Frequency, Audio, Zero-span | Ctrl+2 |
| Transmitter | Frequency, Transmitter | Ctrl+3 |
| Device | Source, Record, Host | Ctrl+4 |
| Scanner PRO | Only in SDR SA PRO and only with a valid key — see Scanner. | Ctrl+5 |
Switching tabs neither interrupts the stream nor changes any setting. If the content of a tab does not fit vertically, a scroll bar appears on the right. A group that does not apply to the source is replaced by an explanation rather than left empty: for a tinySA, for example, the Receiver tab says that the instrument returns levels, not samples, so it has no audio and no zero span.
The “Frequency” group
This group is present on three tabs, and everywhere it is the same VFO — the same band that is drawn on the spectrum.
- Frequency readout
- Ten digits in hertz. The wheel over a digit, or a click on its upper or lower half, changes that digit by one. The readout moves the VFO within the captured band; it does not retune the device — the range fields, the ruler and the wheel over the spectrum do that.
- Mode
- Demodulation:
raw,nfm,wfm,am,dsb,usb,lsb,cw,fpv-video. At start-up it israw. The modes are covered on the page Receiver. - Step
- The grid the VFO frequency snaps to: free (no snapping, the default), 1 kHz, 6.25 kHz, 12.5 kHz, 25 kHz, 100 kHz.
- Bandwidth
- The channel filter width; the slider limits depend on the mode. In
fpv-videothe slider is disabled: the decoder takes the whole captured band. - Edges
- The lower and upper edge of the filter in absolute frequencies.
- Offset
- The shift of the VFO from the centre of the captured band. A red number means the VFO band has gone past the capture edge and that side is not measured; the yellow line below advises moving the centre or narrowing the bandwidth.
The “Bands” group
The list of named bands that label the spectrum. The Show on spectrum checkbox turns the strips on and off. Each row has a colour swatch (a click steps to the next of ten colours), the name, the lower and upper edge in MHz and a delete button.
- Add
- A new band with the edges of the currently selected span.
- Defaults
- Restores the built-in list of twenty bands.
- Open…, Save as…
- A band profile is a separate JSON file. If a file cannot be read, the app names which entry is wrong and why, and carries on with the current list. Edits to the active profile are saved by themselves when the app exits.
The built-in list is a set of hints on the scale, not a frequency plan:
| Band | MHz | Band | MHz |
|---|---|---|---|
| MW broadcast | 0.526–1.606 | ISM 868 | 863–870 |
| HF | 1.8–30 | GSM/LTE 900 | 880–960 |
| CB | 26.965–27.405 | GNSS L1 | 1559–1610 |
| FM broadcast | 87.5–108 | GSM/LTE 1800 | 1710–1880 |
| Airband | 118–137 | DECT | 1880–1900 |
| 2 m amateur | 144–146 | UMTS/LTE 2100 | 1920–2170 |
| Marine | 156–162.05 | S-band telemetry | 2200–2300 |
| 70 cm amateur | 430–440 | Wi-Fi/BT 2.4 | 2400–2483.5 |
| LPD/ISM 433 | 433.05–434.79 | LTE 2600 | 2500–2690 |
| PMR446 | 446–446.2 | Wi-Fi 5 | 5150–5850 |
The “Markers” group
Shows the frequency, bandwidth and mode of the VFO, the visible width of the picture (Visible span) and the zoom factor (Zoom). The free edition has no markers, no peak search, no OBW and no ACPR. In SDR SA PRO PRO with a valid key the Trace markers group stands below this one: markers, peak search and power measurements — see Trace markers.
Help tips
Most items have a “?” circle in front of them. Hover over it and an explanation appears: what the item does and what it costs. Yellow lines under items appear only when the current state spoils the measurement or needs attention.
The trust bar
The line at the bottom of the window is visible from every tab. Always present are RBW, VBW, Detector, Drops and the scale badge (dBFS — UNCAL or dBm — instrument 0.9.25); for IQ sources also N and Window with its ENBW. The rest appears when it has something to say: Bias, Coverage, Averages, Age, Spurs, History, bin/px and the badges BAND CLIPPED and PLL NOT LOCKED 0.9.25, and for a tinySA SWEEPS CUT 0.9.43 when the instrument itself ends the app's sweeps (see tinySA). A tinySA RBW that the app cannot confirm is shown in yellow 0.9.41. In SDR SA PRO PRO the Scanner's ALARMS: N counter appears here too when there are unacknowledged alarms. Every field is explained on the page Trust bar and loss counters.
Menus and keys
| Menu | Item | Key | What it does |
|---|---|---|---|
| File | Open recording… | Ctrl+O | Opens a file chooser but does not switch the source: the app answers Not implemented. |
| Save sweep (CSV)… | Ctrl+E | Saves the current sweep as CSV. Without a sweep it says No sweep is running. For a tinySA it always works 0.9.41: the instrument sweeps by itself; before its first sweep the app says No sweep yet. | |
| Quit | Ctrl+Q | Closes the app. | |
| Instrument | Pause / resume | Space | Pauses and resumes the stream. |
| Autoscale | A | Fits the scale to what is visible, once: the top 6 dB above the peak, the bottom 3 dB below the noise floor. | |
| Whole band | Home | Resets the picture zoom. | |
| Back to live | L | Returns the waterfall from history to the live row. | |
| View | The names of the four tabs (in SDR SA PRO with a key, also Scanner PRO) | Ctrl+1 … Ctrl+4 (Ctrl+5) | Opens the tab; if the panel is hidden or covered by the FPV-video window, shows it first 0.9.42. In older versions the items of the four tabs only showed the panel and did not switch the tab. |
| Side panel | Ctrl+0 | Hides and shows the side panel. | |
| Light theme | Switches the theme of the panels and menus; the graph stays dark. | ||
| Save workspace | Ctrl+S | Saves the window size and position, the layout, the open tab and the spectrum/waterfall split. The same happens when the window is closed. | |
| Reset layout | Ctrl+Shift+R | Puts the panel back on the right at its default width, opens the Spectrum analyzer tab and restores the default spectrum/waterfall split. | |
| Language | Українська, English | Switches the language at once, without a restart. | |
| Help | About | F1 | The name and version, the folders Settings and calibration: and IQ recordings:, a line about the dBFS scale and the line Third-party licences and source code: https://sdrsa.net/ — as plain text, not a link. The FFT and graphics lines are gone since 0.9.31. The code of this computer is gone since 0.9.49 0.9.49: the free edition does not read the hardware (in 0.9.27–0.9.48 the code was shown here). In SDR SA PRO PRO the window also has a License section with the state of the key. |
| License PRO | Only in SDR SA PRO: what is going on with the key, what it enables, and the code of this computer; the key is also entered from here — see SDR SA PRO. |
The FPV-video window
When the fpv-video mode is selected, an FPV-video window with the picture appears between the spectrum and the side panel. It can be pulled off by its title bar and watched as a separate window. It has no close button: it disappears when you leave the mode. In detail — on the page FPV video.
Limits
- The free edition has no markers and no peak search; measuring with the mouse means selecting a span. Trace markers are in SDR SA PRO PRO.
- Open recording… in the menu does not switch the source: a recording is opened only from the picker window at start-up.
- The frequency readout moves the VFO inside the captured band and does not retune the device.
- The side panel sits on the right only; the FPV-video window is the only one that can be detached.
- The overview ruler is linear: narrow spans at the low end of the range cannot be picked on it with the mouse — use the range fields for that.
- The graph is always dark, whatever the theme.