Wiki Spectrum analyzer
Traces
The app keeps four traces, T1…T4, and a reference trace R. Every trace has its own accumulation mode and its own detector, so the live curve, the maximum, the minimum and the average can all be on screen at once. This page covers the modes, the defaults, freezing and fill, the averaging counter, the reference trace, trace math, and when the accumulated data is reset.
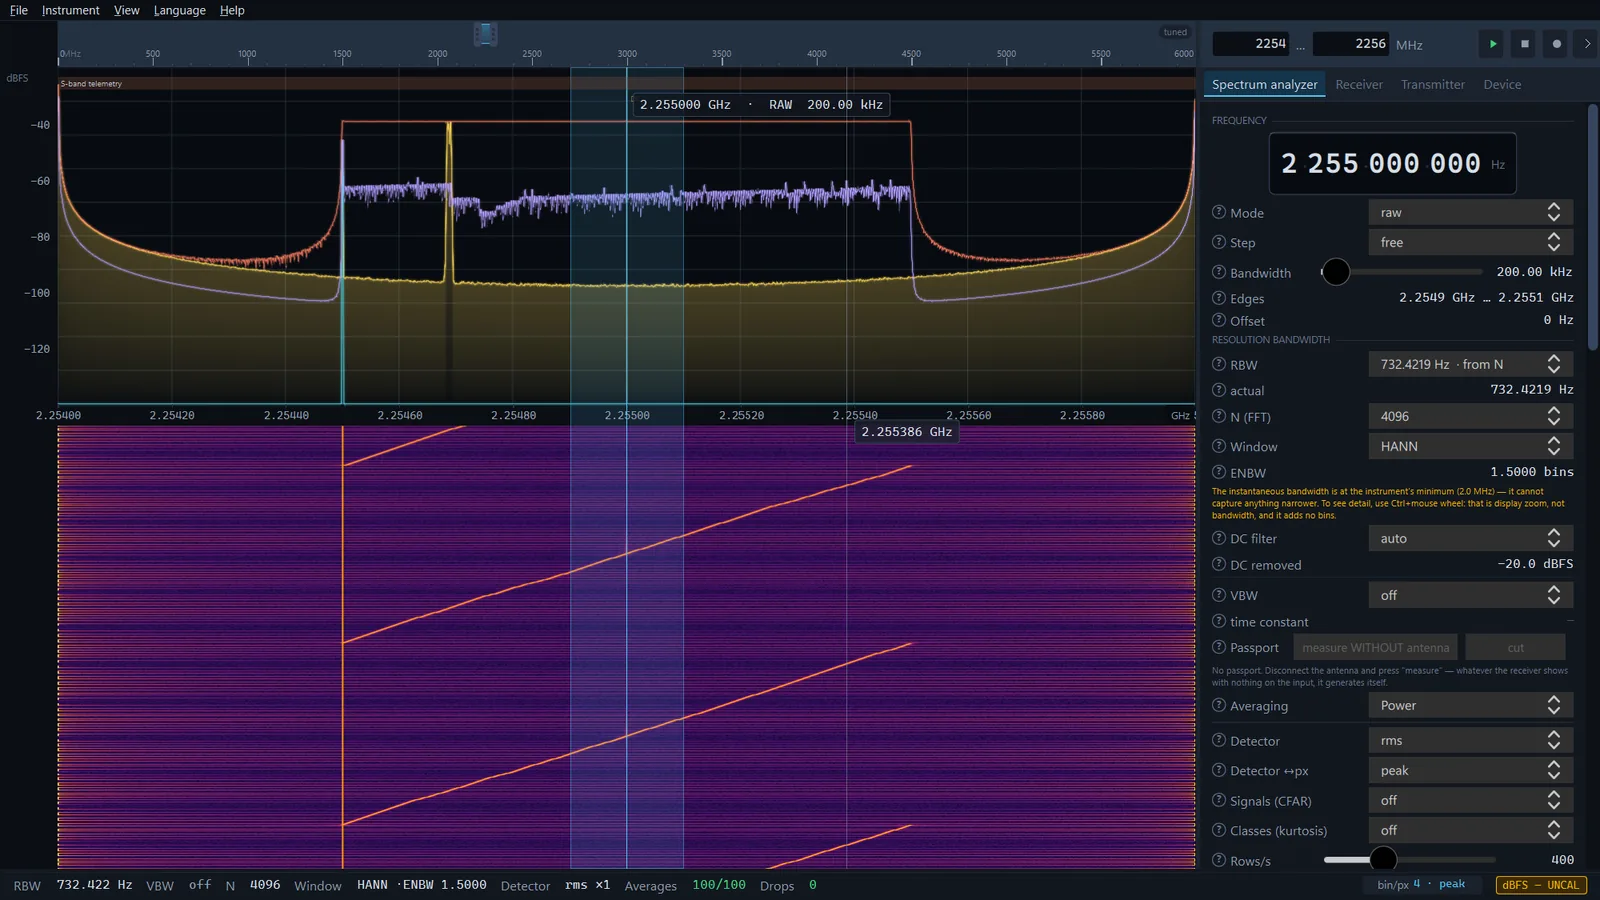
The Traces group
The Spectrum analyzer tab, the Traces group. The "?" circle in front of the group title briefly explains everything below. Each trace has one row:
- a colour swatch and the label T1…T4 (T1 yellow, T2 orange, T3 turquoise, T4 violet; the reference is grey);
- the mode list: off, Live, Max hold, Min hold, Average;
- the detector list — the same list of eleven as for the main detector;
- a freeze button and a fill button.
Under the row of a trace that is on there is a second one: the number of averages (in the Average mode only), the math operation, its second operand and the averaging counter (also in that mode only). The last row of the group is the reference trace, R Ref.
Modes
- off
- The trace is neither drawn nor accumulated. This really is "off", not "hidden": switched on again, it starts from nothing.
- Live
- The live curve: every new frame replaces the previous one.
- Max hold
- The highest value the trace has seen at every point. It keeps a short burst on screen, but it also collects every random noise spike: the floor in Max hold only rises with time, so it is not a noise level.
- Min hold
- The lowest value the trace has seen at every point.
- Average
- The mean. Up to the set number of frames it is cumulative (the third frame really is the mean of three); after that it is exponential with the same constant, so the trace stays alive.
In tuned mode a trace frame is the fold, by the trace's detector, of the spectra from one portion of samples from the device; at 20 MS/s such a portion lasts 6.55 ms. To reset Max hold or Min hold, switch the mode away and back: changing the mode resets the trace.
What is on from the start
| Trace | Mode | Detector | Averages | Fill |
|---|---|---|---|---|
| T1 | Live | peak | 16 | yes |
| T2 | off | peak | 16 | no |
| T3 | off | neg | 16 | no |
| T4 | Average | rms | 100 | no |
So there are two curves on screen from the beginning: T1 tells whether a burst happened, T4 what the mean level is. T2 and T3 are off and wait with their own detectors: pick Max hold in T2 to get the highest seen, and Min hold in T3 to get the lowest. Trace settings are not kept between launches: the app always starts from this table.
The trace detector
The detector decides what goes into the trace from every portion of spectra; the mode decides what the trace does with it next. The detectors are described on the Detectors page; three things matter here. Changing the detector resets what that trace has accumulated. In a sweep the trace detector acts along frequency (see below). With a tinySA 0.9.25 the list is disabled and shows instrument: the analyzer folds the row itself.
Average and the averaging counter
- The number of averages is a field with a number from 1 to 10000 in the second row of the trace; it appears in the Average mode only. Changing the number does not reset the trace.
- The counter on the right of the same row, for example
37/100: how many frames have already gone into the mean. Until the set number is reached it is amber; once reached it is green and stays at100/100, because from then on the effective number of averages is exactly that. - The same number stands in the trust bar, in the Averages field: a trace on its third frame of a hundred and on its hundredth of a hundred are different measurements, and the app does not keep quiet about which of them is on screen.
- Whether power or decibels are averaged is decided by the Averaging switch; the VBW video filter acts on all traces and sits ahead of the accumulation.
Freezing and fill
- The freeze button
- Its tooltip is Freeze trace. A frozen trace stops taking new frames and stays on screen as a snapshot; the button turns amber and the tooltip changes to Trace frozen — new frames are not written to it. The snapshot survives a retune, which makes it a convenient baseline for comparison. After a retune it lies on the new axis as a shape for comparison, not as levels at these frequencies, and nothing on screen says so. 0.9.40 A trace unfrozen after a retune starts afresh: new frames are not laid over what was accumulated at another frequency.
- The fill button
- Its tooltip is Fill the area under the trace (max hold on top and min hold below together look like an accumulation); pressing it again gives Remove the fill under the trace. Only T1 is filled from the start: four filled areas would cover one another.
The reference trace R
The reference is a snapshot of a trace. It does not update and is drawn as a grey line beneath the other traces.
- The T1…T4 buttons in the R Ref row take the reference from the corresponding trace. What is taken is the accumulated level of the trace itself — before math.
- Next to it the row says where it was taken from (for example
T1), or none. - The button with a cross is Clear reference.
- If the trace is still empty, an amber line appears: There is nothing to take the reference from: this trace is still empty. In a sweep it appears after the first completed pass.
- The reference survives a retune in tuned mode. Entering a sweep, leaving it or its rebuild removes it with an explanation: The reference was removed: the frequency axis changed (entering a sweep, leaving it, or its rebuild). Take it again.
The reference serves two purposes: comparing "before and after" on one screen, and being the second operand in trace math.
Trace math
The second row of every trace that is on holds two lists: the operation and the second operand. The first operand (A) is the trace itself, the second (B) is T1, T2, T3, T4 or Ref (the reference). By default the second operand of T1 is T2, and of the others T1.
none- No math — the trace as it is.
a-b- Subtracts power, not decibels: this is how a measured noise pedestal is removed. There is no negative power, so where A is smaller than B the result is clipped from below.
a/b- Divides the powers, that is, gives the difference of levels in decibels: this is how a trace is normalised to the reference. The result is a ratio, not a level: on the axis it lies near zero.
max- The larger of the two values at every point.
A−B and A/B are different operations, and confusing them costs 3 dB. An example: trace A is 3 dB above B. a/b shows +3 dB — by how much A is higher. a-b shows a level equal to B: the power of A is twice that of B, and after the subtraction exactly as much as B is left — 3 dB below A.
- If the second operand is missing (the trace is off, no reference has been taken) or it has a different number of points, the raw trace is shown without math.
- In a sweep the result exists only at points where both operands were measured.
- Excess over the local noise: give the second trace the
floordetector and the first onea/bwith that trace (see floor).
When the accumulated data is reset
| What happened | What is reset |
|---|---|
| The mode or the detector of a trace was changed | That trace only |
| Averaging was changed (Power / Log) | All four traces |
| A retune in tuned mode | All traces except frozen ones; the reference stays |
| A trace frozen before a retune is unfrozen 0.9.40 | That trace |
| N, the window or the sample rate was changed; the device was reconnected | All traces, frozen ones included |
| Entering a sweep, leaving it, its rebuild | All traces and the reference |
| tinySA: the sweep is shifted or its width changed | All traces except frozen ones; the reference stays |
| tinySA: the number of points is changed 0.9.41 | All traces, frozen ones included, and the reference |
The reason is the same everywhere: accumulated data belongs to the frequency axis and the bin grid it was collected on. A Max hold that, after a 100 MHz step, kept the peaks of the previous frequency under the new axis labels would be a forgery. A trace is not reset by changing the number of averages or the VBW, by freezing, fill, math, the scale or the display zoom.
Traces in a sweep
In a sweep the same set works: modes, freezing, the reference, math. The differences are these:
- Live updates live, as the segments arrive. Max hold, Min hold and Average build up between passes — once per completed pass, as in a swept analyzer. The averaging counter counts passes.
- Until the first completed pass these three traces are empty.
- The pass with a shifted local oscillator, which the app uses to check for spurs, does not go into the traces.
- The trace detector acts along frequency: it decides how the bins of the stitched grid are reduced into a trace point. The spectra of one segment are folded by the main detector.
- An unmeasured point (a bin cut by the passport, a segment that did not arrive) stays a hole in Live, while in hold and Average it keeps its value. Average keeps a count for every point separately: the mean is taken only from what was really measured at that point.
- With the VBW on, the live trace is updated once per pass.
Limits
- There are four traces and one reference; no more can be added.
- Trace settings, the reference and the accumulated data are not kept between launches.
- Max hold is not a noise-level measurement: its floor rises for as long as the accumulation runs.
- The free edition has no markers or peak search on the traces — see Limits and roadmap. SDR SA PRO PRO has six trace markers: peak search, the difference between two markers, noise density, the power in the band between markers, the occupied bandwidth (OBW) and the adjacent channels (ACPR) — see Trace markers.
- The Max and Min numbers for a range selected with the mouse are taken from the live spectrum, not from the traces: Max hold would show "the highest ever seen" there rather than what is there now.
- With a tinySA the modes, the reference and math work, but there is no choice of detector.